• October 25, 2025: We are pleased to announce the release of our new web server: N•ESPript It has been designed for the representation of multiple alignments of nucleic acid sequences, including the visualization of their secondary structures.
If you publish data resulting from the use of FoldScript, we would be grateful if you would include an appropriate citation:
Robert, X., Guillon, C. and Gouet, P. (2025) FoldScript: a web server for the efficient analysis of AI-generated 3D protein models. Nucleic Acids Res.53(W1), W277-W282 - doi: 10.1093/nar/gkaf326 (freely accessible online).
Do not hesitate to contact us (espript@ibcp.fr) if you need any further information or help with FoldScript.
Preamble
To illustrate this documentation, you can access a demonstration session by clicking the button below. The model files in PDB format used in the latter can be downloaded by clicking here. They consist of a heterodimer of the Human Immunodeficiency Virus 1 IN and RT proteins produced by AlphaFold 3.
3D modelling programs using artificial intelligence (AI) have revolutionised structural biology by enabling the prediction of protein structures with an unprecedented level of confidence, whether in monomeric or multimeric states and, for some software, in complex with nucleic acids, ligands or ions.
However, these predicted structures remain models and divergences in predictions can be observed between distinct AI modelling algorithms (e.g.AlphaFold 2 (1), AlphaFold 3 (2), RoseTTAFold (3), ESMFold (4)) as reported in this article by Guillon et al. (5).
AlphaFold 2 and 3 generate, by default and for the same run, respectively 25 and 5 different models ranked with a confidence score. Faced with this quantity of data, the task of examining and comparing models is time-consuming and tedious. Consequently, in our experience, many users tend to only retain the top-ranked model.
However, it is judicious not to limit ourselves to the model with the best score and, notably, to include previously known experimental data in the choice of the most relevant model. Thus, it often appears that the "best" solution proposed by AlphaFold is not always the most reliable and basing our choice solely on confidence scores is far too simplistic.
The FoldScript server was created to respond effectively and rationally to these questions. In this goal, FoldScript performs an automated and detailed analysis of the structural information of the multi-models set produced by AlphaFold 2 or 3. It synthesises, in a comparative and intelligible flat figure, the primary to quaternary structural information of the models to guide the user in his decision making. In addition, this analysis can be refined by introducing previously known interaction data in order to identify the most relevant model(s).
FoldScript thus enables a large community, whether specialised in structural biology or not, to easily analyse datasets of AI-generated 3D models, and provides rational support in finding the "true best model(s)"
FoldScript complements our ESPript and ENDscript Web servers to allow comprehensive analysis of experimental or predicted protein structures (6-7).
Overview of the FoldScript pipeline
To extract as much relevant information as possible from the models, FoldScript utilises a combination of sequence and structure analysis software:
MAXIT, an RCSB program to assist in the processing and curation of macromolecular structure data.
SPDB, a homemade program to extract sequence, check residue numbering and chain IDs and parse structural components from the query model files.
DSSP (8,9), to extract secondary structure elements, disulfide bridges and solvent accessibility per residue.
CNS (10), to determine protein:protein and protein:ligand contact distances, if present.
BLAST+ (11), to search for protein homologues using the sequence of the query against a chosen sequence database.
Clustal Omega (12), to perform a multiple sequence alignment from the BLAST+ sequence hits.
ESPript core program (6-7), to gather and render all this information with a detailed flat figure.
PyMOL (13), to render the mosaic representations of the models allowing easy visual comparison.
NGL Viewer (14), to prepare and display interactive 3D views.
TM-score (15), for assessing the topological similarity of protein structures.
The results are presented at the end of this pipeline. A graphical Web interface allows you to customise the generated representation and to obtain additional information (several types of interactive 3D visualization of the models, tables and histogram of intermolecular contacts, a tool to determine the most likely model(s) based on prior knowledge of inter- or intramolecular contacts).
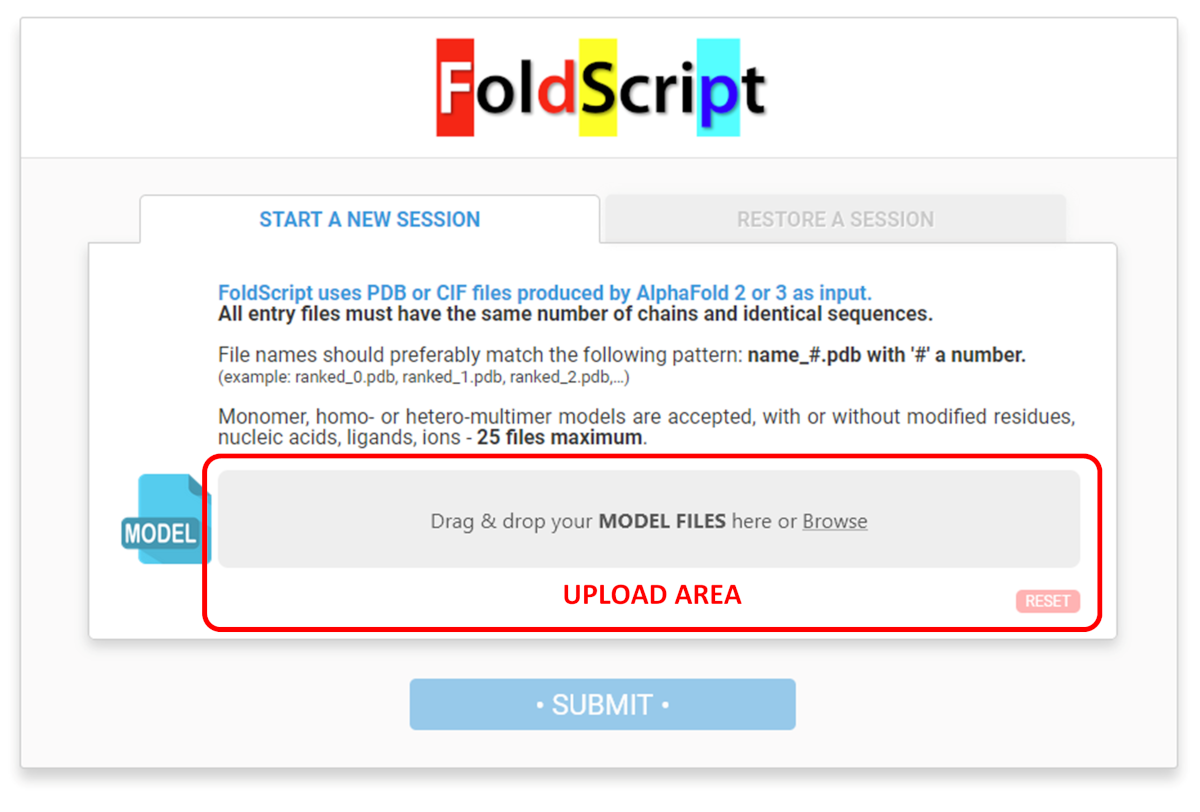
Uploading your AI models to FoldScript
FoldScript takes as input the 3D coordinate PDB or CIF files generated by AlphaFold 2 or 3. (e.g. the 25 or 5 models generated by default by AlphaFold 2 or 3, respectively)
On the upload page, drag and drop your model files onto the grey area or click on it to browse for them from your computer:
All entry files must correspond to a modelling run conducted with the same proteinaceous components. They must have the same number of chains and identical sequences, otherwise FoldScript will produce an error message.
File names should follow the pattern: ranked_# (where '#' is a number). (example: ranked_0.pdb, ranked_1.pdb, ranked_2.pdb, etc.) If it is not the case, the uploaded files are automatically renamed and renumbered according to this pattern. (e.g. ranked_0 to ranked_24)
Monomeric, homo- or hetero-multimeric models are accepted, with or without modified residue(s) / nucleic acid(s) / ligand(s) / ion(s).
A maximum of 25 model files can be uploaded.
Once all the files have been uploaded to the server (all progress bars coloured green), click on the blue 'SUBMIT' button to launch the FoldScript analysis.
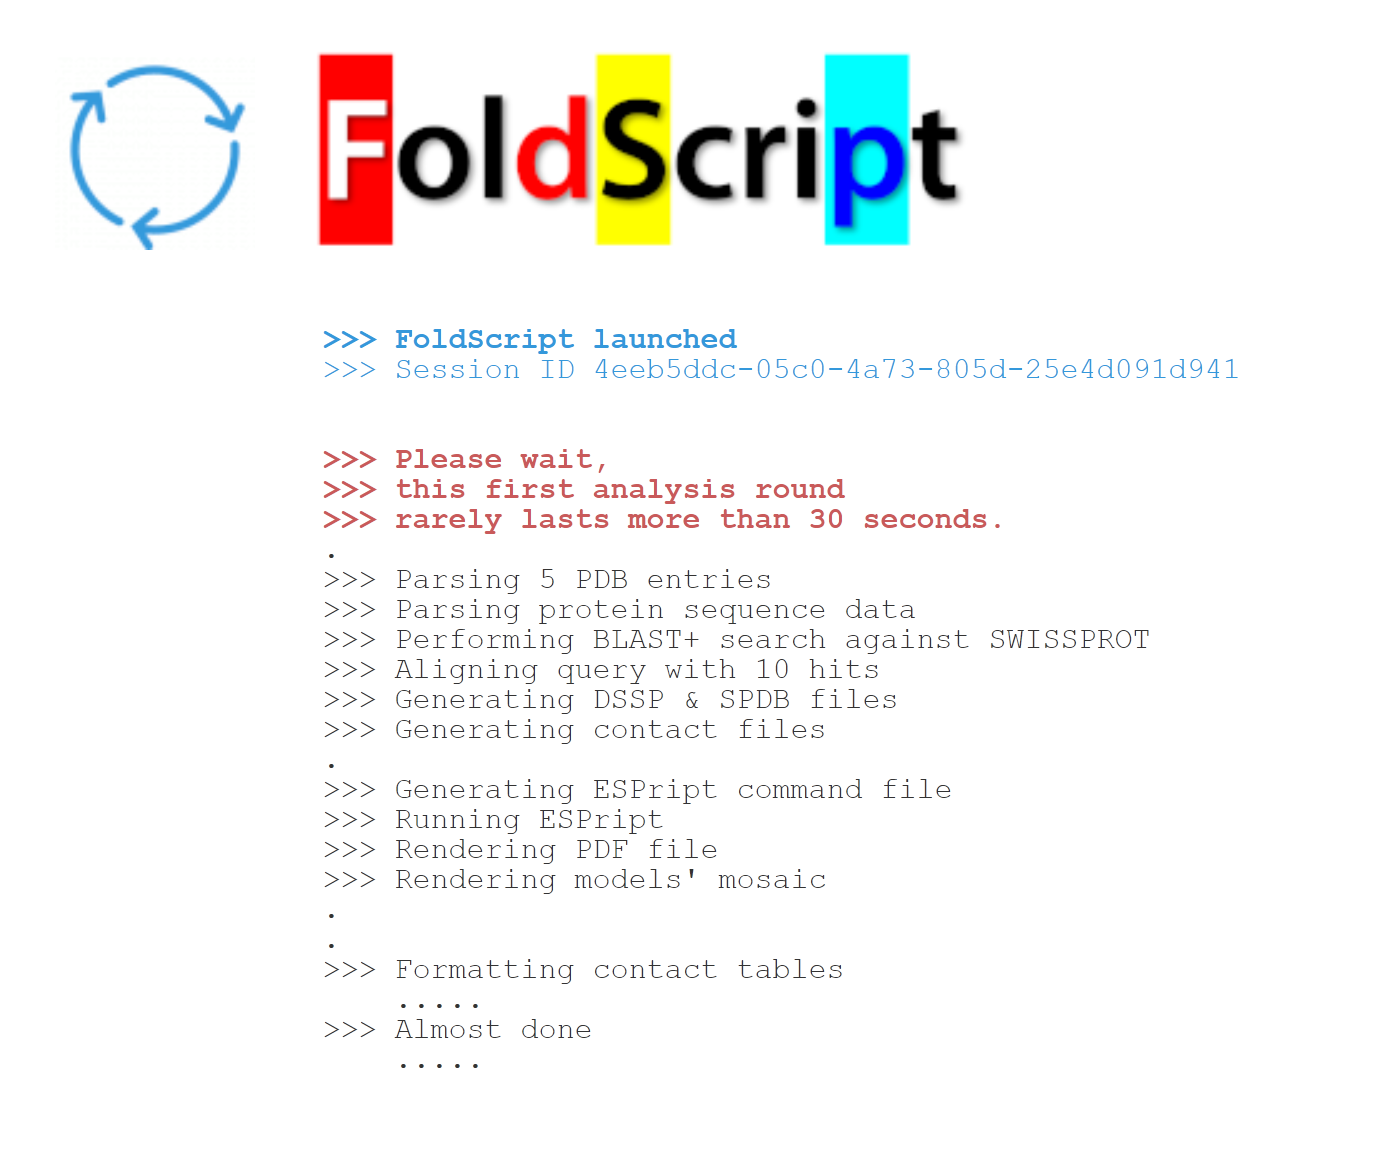
The progress of the data analysis is displayed as shown in the figure opposite. This first run usually takes less than 30 seconds. It should be noted that larger models may require additional processing time, although this should not exceed two minutes.
Stay on the page and wait, the Results page will be displayed at the end of the process.
Presentation of the results
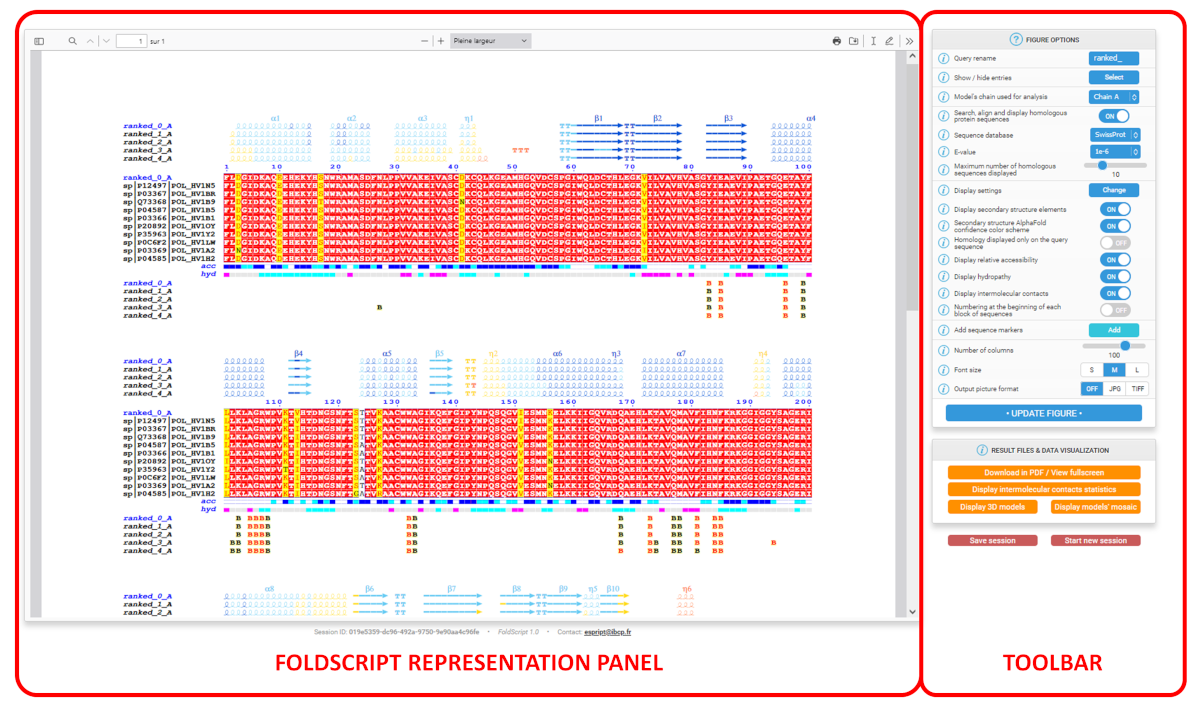
Once this calculation step is completed, the Results page appears. The latter is divided into three parts (see screenshot below):
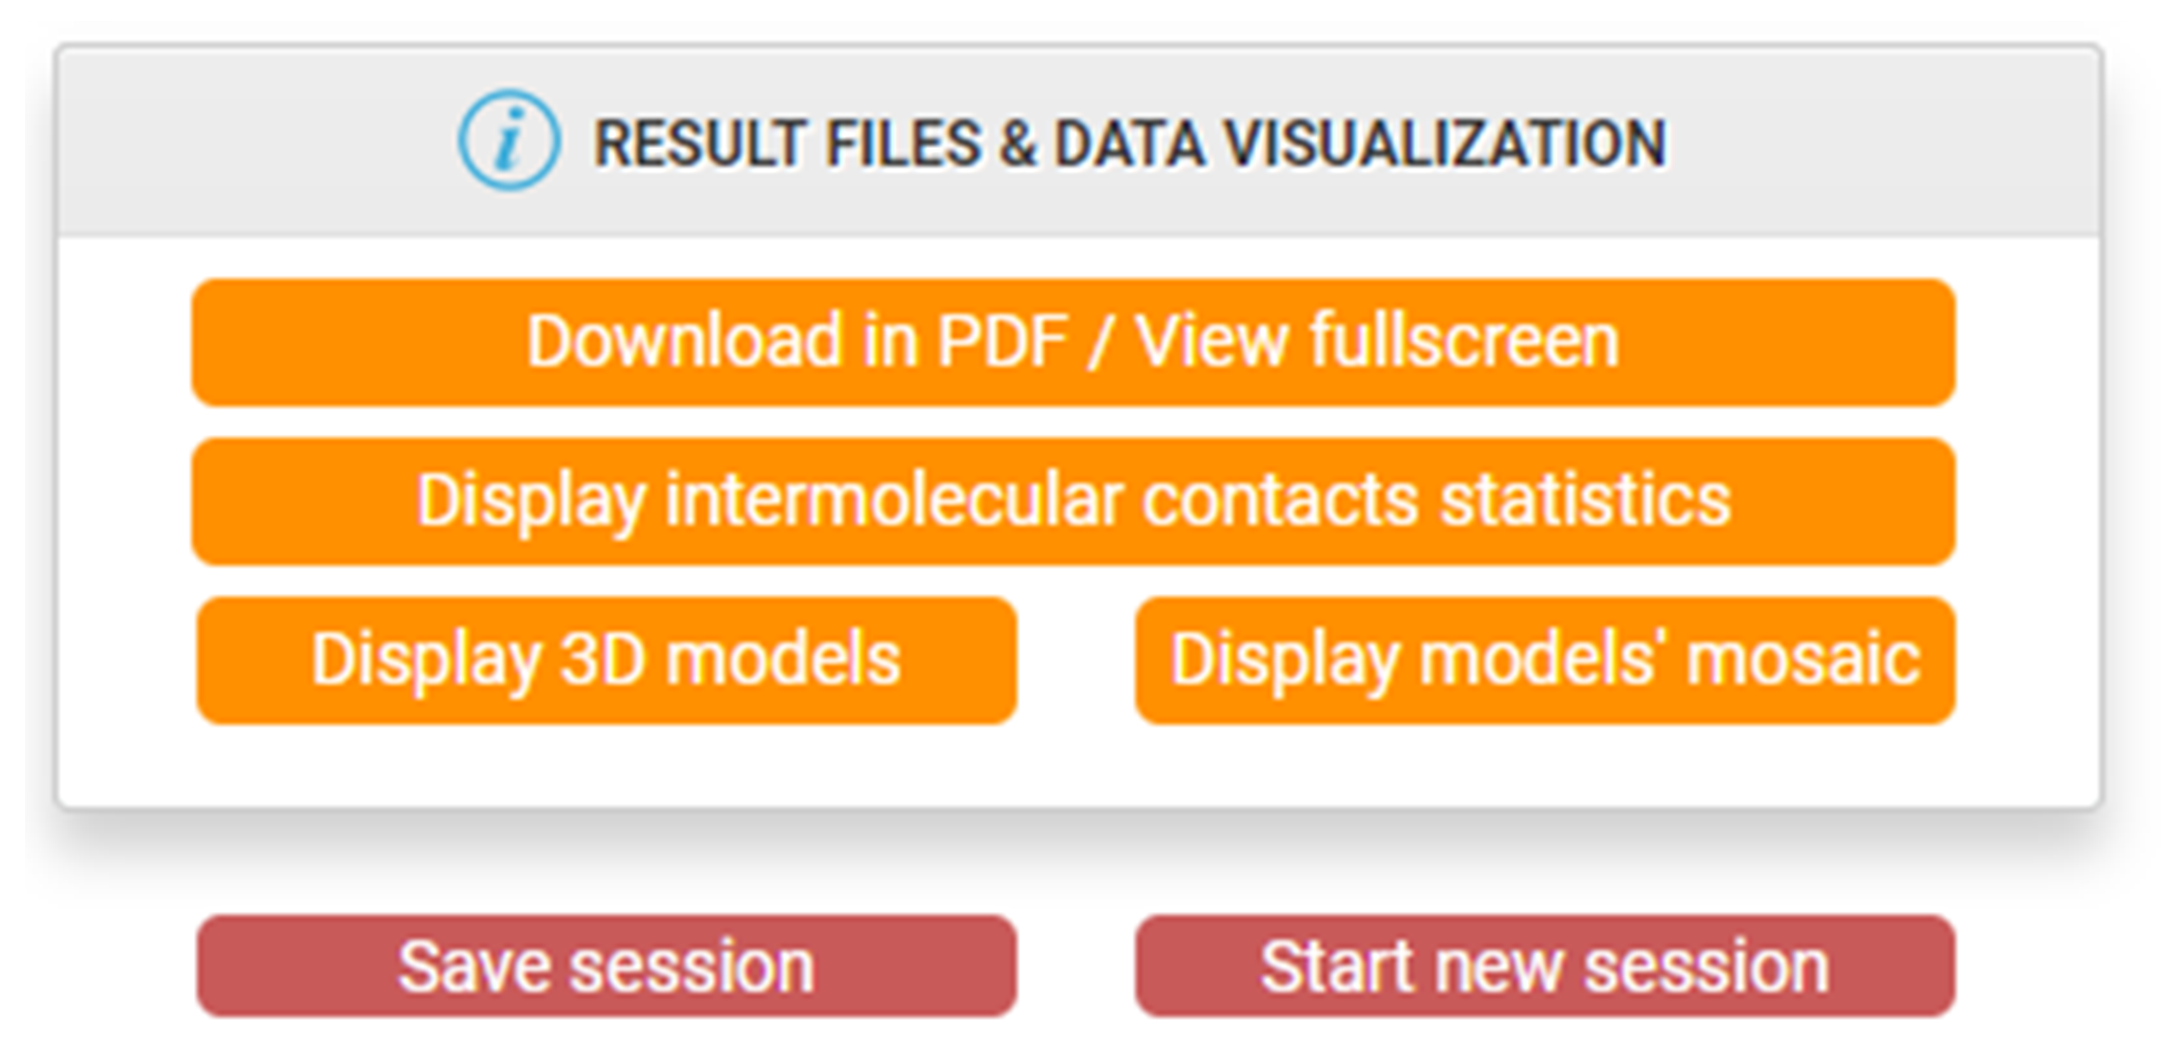
At the top, a button toolbar lets you download the results files and access additional tools and results (see "Top toolbar with additional tools" section).
On the left, the FoldScript representation panel, which summarises the information gathered from the analysis (see below).
On the right, the main vertical toolbar for customising the FoldScript representation (see "FIGURE OPTIONS toolbar" section).
Depending on your browser, the main representation viewer allows you to carry out certain operations: zoom in, zoom out, scroll horizontally or vertically, print the figure, save it in PDF format, add annotations, etc. Please refer to your browser manual for more information on these options.
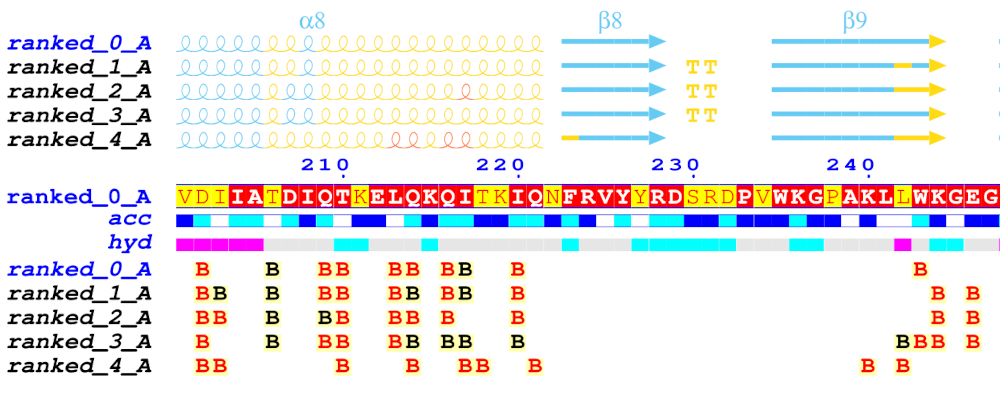
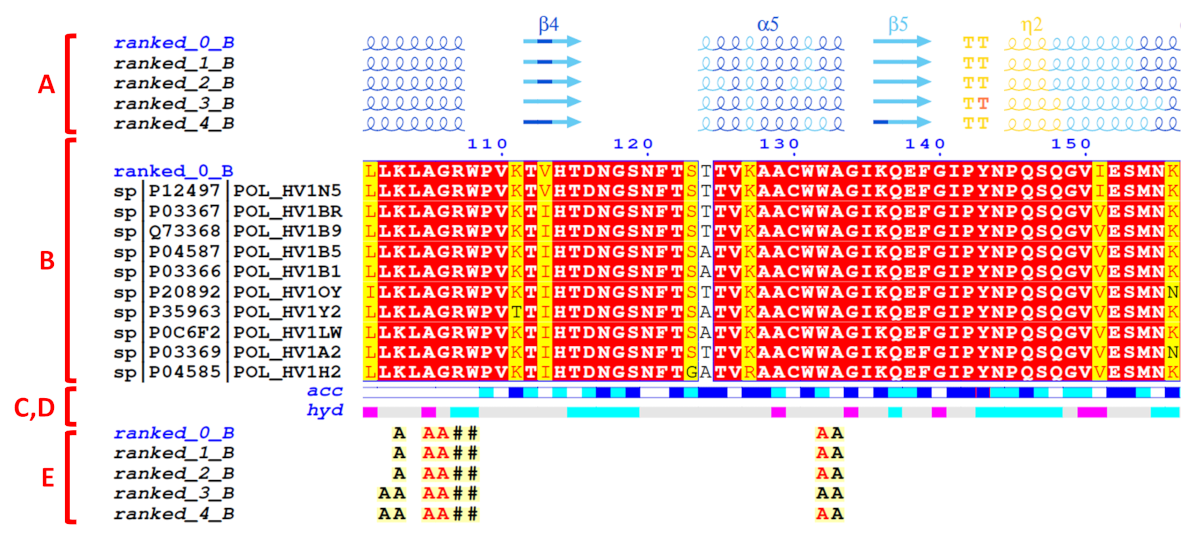
The default FoldScript representation (see an excerpt below) depicts from A. (top) to E. (bottom):
A. For each uploaded model (sorted in alphanumeric order), secondary structure elements are extracted from the PDB/CIF query files. Each model is named using the following convention: Prefix ('ranked_' by default), a number (corresponding to the rank), an '_' character followed by an uppercase letter indicating the selected chain ID of the model ('A' by default).
α-, 310- and π-helices are shown as medium, small and large squiggles with α, β and π labels, respectively.
β-strands are shown as arrows labeled β.
Strict α- and β-turns are indicated by TTT and TT letters, respectively.
In addition, when models have been predicted with AlphaFold, FoldScript can colour secondary structure elements according to the local modelling confidence score called pLDDT, which ranges from 0 to 100:
Regions with pLDDT > 90 (coloured in blue) are expected to be modelled with high accuracy. They could be suitable for any application that benefits from such precision (e.g. characterising a binding site).
Regions with pLDDT between 70 and 90 (coloured in cyan) are expected to be modelled well (a generally good backbone prediction).
Regions with pLDDT between 50 and 70 (coloured in yellow) are low confidence and should be treated with caution.
Regions with pLDDT < 50 (coloured in orange) often have a ribbon-like appearance and should not be interpreted. These regions could also be a reasonably strong predictor of disorder.
B. Below the representation of the secondary structure elements is a multiple sequence alignment produced by Clustal Omega, that includes the query model sequence and, by default, the top 10 homologous sequences identified by a BLAST+ search against the UniprotKB/Swiss-Prot sequence database.
This alignment is coloured according to residue conservation. A percentage of equivalent residues is calculated per columns considering physico-chemical properties with a threshold set at 70%: HKR are polar positive, DE are polar negative, STNQ are polar neutral, AVLIM are non-polar aliphatic, FYW are non-polar aromatic.
As a result, residue letters are written in white on a red background in case of strict identity (100% similarity); in red on a yellow background if the score is in the range 70-99% (significant similarity); in black if the score is below 70% (low similarity).
C.The relative accessibility (labelled 'acc') calculated by DSSP for each residue of the top-ranked model is shown with a coloured bar below the sequences block: white is buried, cyan is intermediate, blue is accessible and blue with red borders is highly exposed.
D.The hydropathy (labelled 'hyd') calculated from the query sequence using the Kyte & Doolittle algorithm (16) is shown by a second coloured bar below the accessibility: pink is hydrophobic, grey is intermediate and cyan is hydrophilic.
E.Protein:protein and/or protein:ligand intermolecular contacts calculated by CNS are presented for each models with the selected protein chain ('A' by default).
A to Z or a to z means that the amino acid residue in question has a contact with an amino acid residue in the chain of the letter displayed. Contact letters or symbols (see the table below) are written in red if the shortest contact distance is < 3.2 Å and in black if the shortest contact distance is in the range 3.2 - 3.7 Å. For example, in the FoldScript figure above, chain 'A' is selected ('ranked_*_A') and, for the top-ranked model (contact line labelled 'ranked_0_A'), residue F61 of chain A is in contact with a residue of chain B with the shortest contact distance being less than 3.2 Å (red B letter).
# indicates a contact between two amino acid residues with the same name and number (e.g. along a 2-fold axis).
Disulfide bridges are shown by digits/letters pairs, coloured green in the case of an intramolecular bridge (1 1) or cyan in the case of an intermolecular bridge (1 1). Thus, two cysteine residues linked by a disulfide bridge are marked with the same number.
* / : " + ^ symbols indicate that the amino acid residue in question has a contact with a ligand. To date, all ligands proposed by AlphaFold 3 are supported (see table below):
Hetero-compound type
Name
Symbol
Nucleotides
ADE ADP AMP ATP CYT FAD FMN GDP GTP GUA
NAD NAH NAP NDP THY URI
*
A T G C U DA DT DG DC
/
Porphyrin groups
BCL BCB BPH CLA CHL HEC HEM MQ7
:
Sugars
FUC GAL GLC MAN NAG SIA XYL
"
Ions
CA CL CO CU FE K MG MN NA ZN
+
Fatty acids & miscellaneous
CIT MYR OLA PLM
^
Note: ligands not present in the table above are not considered in the analysis performed by FoldScript.
Further information is given with colours:
A red letter / symbol indicates a contact < 3.2 Å.
A black letter / symbol indicates a contact between 3.2 Å and 3.7 Å.
A blue frame identifies an amino acid residue involved in both a protein:protein and a protein:ligand contact.
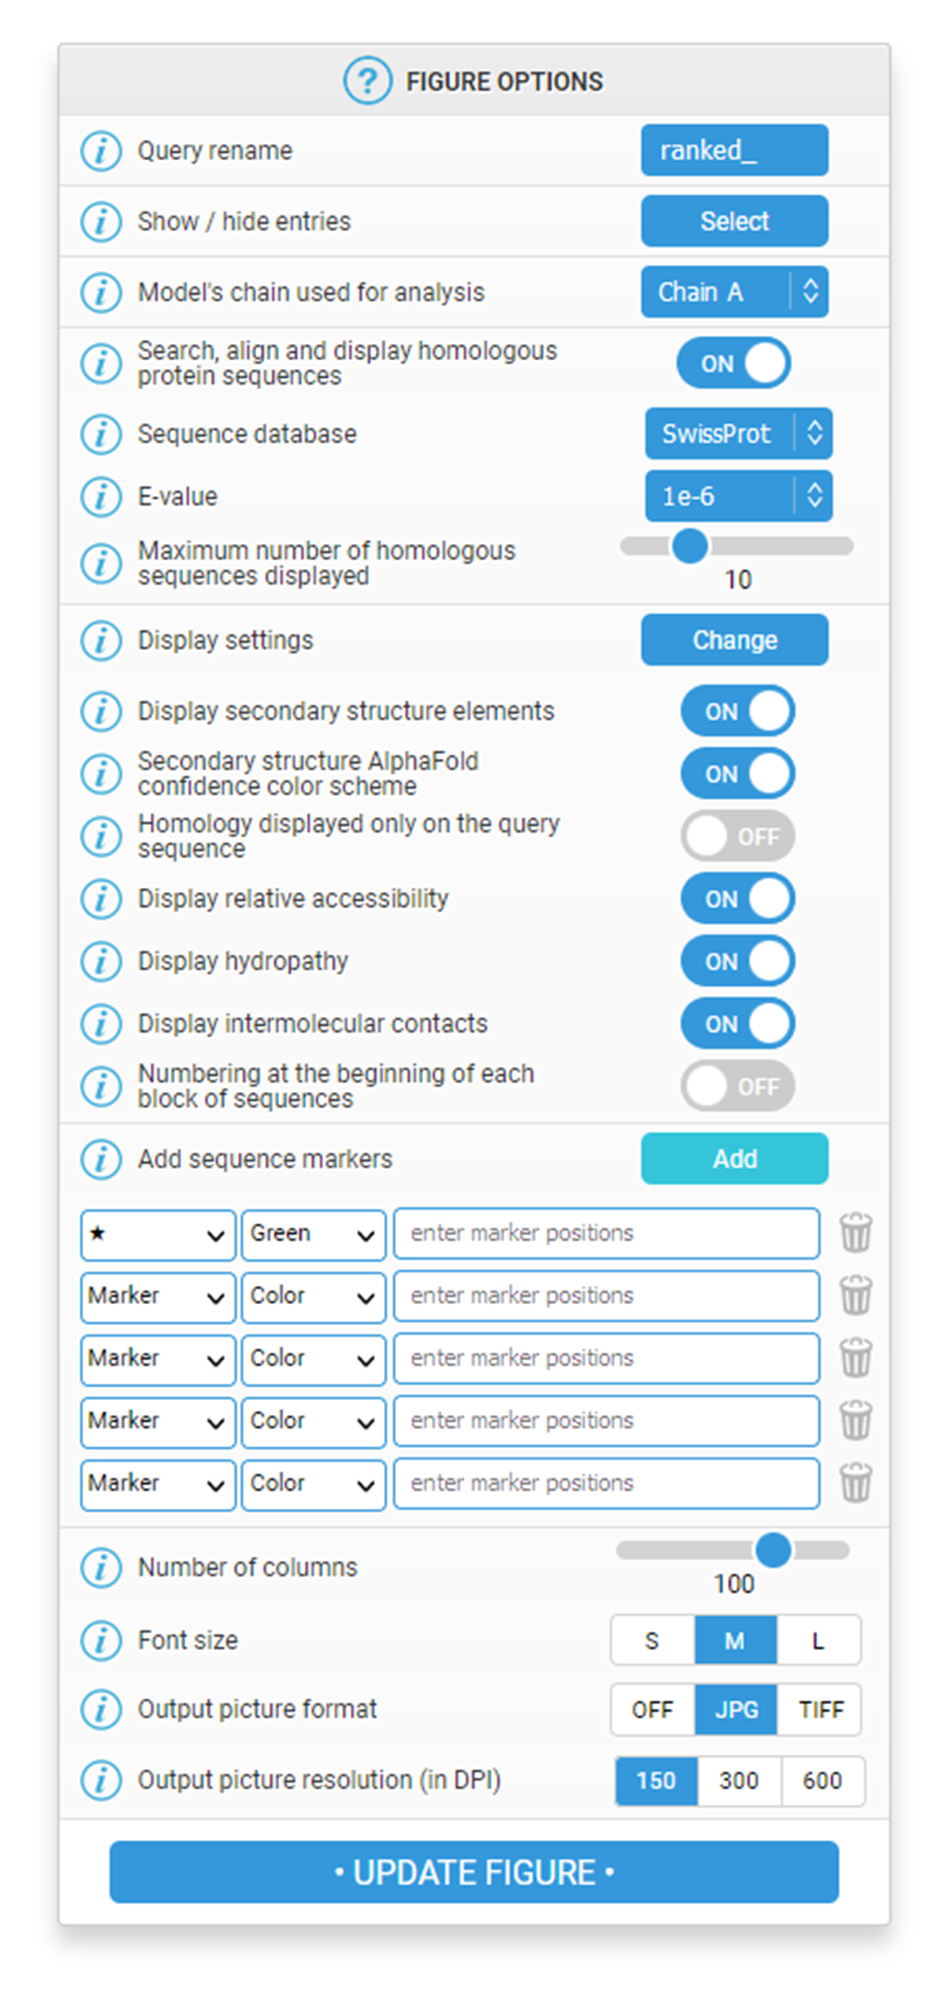
"FIGURE OPTIONS" toolbar
On the right hand side of the Results page, a vertical toolbar allows you to customise the FoldScript representation at your convenience with several options.
For all of them, a tooltip icon provides a help text when hovering the mouse over it.
To apply one or more changes, you must regenerate the figure by clicking on the blue "UPDATE FIGURE" button located at the bottom of the toolbar. A short calculation step is then performed and the updated figure is displayed.
⚠ Please note that any session will be permanently deleted from the server after 24 hours of inactivity and that none of your data will be retained after this time.
Query rename: you can rename your query with a different prefix ('ranked_' by default), using up to 15 characters with only alphanumeric characters and the symbols - and _. Note that by hovering the mouse over the icon, you can see the name mapping between your uploaded model files and the names shown in the FoldScript representation.
Show / hide entries: clicking this button brings up a drop down list allowing you to choose whether or not to show some of the 3D models you have uploaded. Only selected entries are included in subsequent analyses and representations. At least one entry must be selected.
Model's chain used for analysis: this option is only available if the uploaded models are multimeric. It allows you to select the chain ID of the model to be used in the subsequent analyses and representations. Chain A is selected by default.
Reference model: this selector allows you to choose the reference model that will be displayed in the first row of the secondary structure elements and intermolecular contacts blocks. In addition, the relative accessibility bar is calculated based on this reference model. By default, the first model in alphabetical order (usually ranked_0) is selected.
Search, align and display homologous protein sequences: when enabled, this option displays a multiple sequence alignment of homologous proteins to the query coloured according to residue conservation. In this goal, a BLAST+ search is performed against the UniProtKB/Swiss-Prot (default) or the PDBAA databases to find homologues. Hits are piped to Clustal Omega in order to obtain a multiple sequence alignment of the query with these homologous sequences. The resulting alignment is coloured according to the degree of similarity (see "Presentation of the results" section).
This "Search, align and display homologous protein sequences" option is coupled with the following four:
Sequence database: defines the sequence database screened by the BLAST+ search. Several choices are possible: SwissProt (Swiss-Prot database from the UniProt Knowledgebase), PDBAA (sequences derived from the PDB, the experimentally-determined 3D structure database) or PDBAA95, PDBAA90, PDBAA70, PDBAA50 (PDBAA with clustering of protein chains at 95%, 90%, 70% and 50% sequence identity, respectively).
E-value: sets the threshold for retaining sequence matches identified by the BLAST+ search. The E-value gives an indication of the statistical significance of a given pairwise alignment. Thus, the lower the E-value is (the closer it is to zero), the more significant the matches are.
Sequences output order: controls the order of the sequences in the multiple sequence alignment. If 'Aligned' is selected, closely related sequences are automatically grouped. If 'Input' is selected, sequences are sorted in descending order of homology.
Maximum number of homologous sequences displayed: at the end of the BLAST+ search, only this maximum number of sequences is retained before being then aligned with Clustal Omega and finally represented. You can select a value between 1 and 25.
Display Settings: this drop-down menu allows you to show or hide various representation elements listed below:
Display secondary structure elements: if enabled, displays secondary structure elements of each uploaded model file above the sequences block.
Secondary structure AlphaFold confidence colour scheme: colours secondary structure elements according to the pLDDT confidence score. AlphaFold produces a per-residue estimate of the modelling confidence called pLDDT. When enabled, regions with pLDDT > 90 (very high model confidence) are coloured in blue; regions between 70 and 90 (confident) in cyan; regions between 50 and 70 (low confidence) in yellow and regions < 50 (very low confidence) are coloured in orange. If the option is set to 'OFF', all secondary structure elements are coloured in black.
Homology displayed only on the query sequence: by activating this option, multiple sequence alignment is no longer displayed but homology information extracted from the BLAST+/Clustal Omega process is colour-coded on the sequence of the model (see figure below).
Display relative accessibility: if enabled, displays the relative accessibility calculated by the DSSP program for the top-ranked model. It is displayed as a coloured bar (labelled 'acc') located below the sequences block (blue, accessible; cyan, intermediate; white, buried).
Display hydropathy: if enabled, displays the hydropathy calculated using the Kyte & Doolittle algorithm (16) for the query sequence. It is displayed as a coloured bar (labelled 'hyd') located below the sequences block (pink, hydrophobic; grey, intermediate; cyan, hydrophilic).
Display intermolecular contacts: this option is only available if your AlphaFold model is a multimer and/or contains nucleic acid(s) / ligand(s) / ion(s). It allows the display of protein:protein and/or protein:ligand contacts. They are displayed below the sequences block or, if enabled, below the accessibility / hydropathy bars. The reference chain is the one selected with the "Model's chain used for analysis" option.
Contact ratings are depicted as follows:
A to Z or a to z means that the amino acid residue in question has a contact with an amino acid residue in the chain of the letter displayed. Contact letters or symbols (see the table below) are written in red if the shortest contact distance is < 3.2 Å or in black if the shortest contact distance is in the range 3.2 - 3.7 Å.
# identicates a contact between two amino acid residues with the same names and numbers (e.g. along a 2-fold axis).
Disulfide bridges are indicated by digits/letters pairs, coloured green in the case of an intramolecular bridge (1 1) or cyan in the case of an intermolecular bridge (1 1). Thus, two cysteine residues linked by a disulfide bridge are marked with the same number.
* / : " + ^ symbols indicate that the amino acid residue in question has a contact with a ligand. To date, all ligands proposed by AlphaFold 3 are supported (see table below):
Hetero-compound type
Name
Symbol
Nucleotides
ADE ADP AMP ATP CYT FAD FMN GDP GTP GUA
NAD NAH NAP NDP THY URI
*
A T G C U DA DT DG DC
/
Porphyrin groups
BCL BCB BPH CLA CHL HEC HEM MQ7
:
Sugars
FUC GAL GLC MAN NAG SIA XYL
"
Ions
CA CL CO CU FE K MG MN NA ZN
+
Fatty acids & miscellaneous
CIT MYR OLA PLM
^
Note: ligands not present in the table above are not considered in the analysis performed by FoldScript.
Further information is provide by colours:
A red letter / symbol indicates a contact < 3.2 Å.
A black letter / symbol indicates a contact between 3.2 Å and 3.7 Å.
A blue frame identifies a residue involved in both a protein:protein and a protein:ligand contact.
Numbering at the beginning of each block of sequences: by default ('OFF' selected), the first sequence is numbered every ten residues by markers placed above it. If enabled, all sequences are numbered at the beginning of each block.
Add sequence markers: this drop-down form allows to add user-supplied markers below the accessibility / hydrophobicity bars (if displayed). You can add up to 5 different sets, each defined by a symbol (5 possible choices), a colour (among 10 possible) and a position. The position is specified with the following syntax: 5-10 103 110-112 153 will add a marker at residues 5 to 10, 103, 110 to 112 and finally 153.
Number of columns: this option defines the number of columns in the representation, including the sequence naming area on the left. Note that this value is automatically reduced if it results in the alignment not fitting entirely within the width of the page (which may be the case when using a large font size - see option below).
Font size: this option defines the size for the 'Courier' font used in the secondary structure elements / sequence representation. Three sizes are available: Small, Medium or Large.
Output picture format: in addition to the default PDF output format, you can generate figures in JPG or TIFF for presentation or publication purposes. If 'OFF' is selected, the FoldScript representation will only be available in PDF.
Output picture resolution (in DPI): you can choose to render the JPG or TIFF output pictures (if requested) in three resolutions (150, 300 or 600 DPI). High DPI resolutions (300 or 600) are only recommended for publication-quality figures.
Top button toolbar with additional tools
This toolbar, located at the top of the page, allows you to access other tools for displaying or analysing your models:
"Download in PDF" top button: it allows you, depending on your browser configuration, to download the representation generated by FoldScript in PDF format or to display it in full screen. This button can be accompanied by a second one (named either "Download in JPG" or "Download in TIFF") if you have requested an output in one of these formats using the "Output picture format" option (see above).
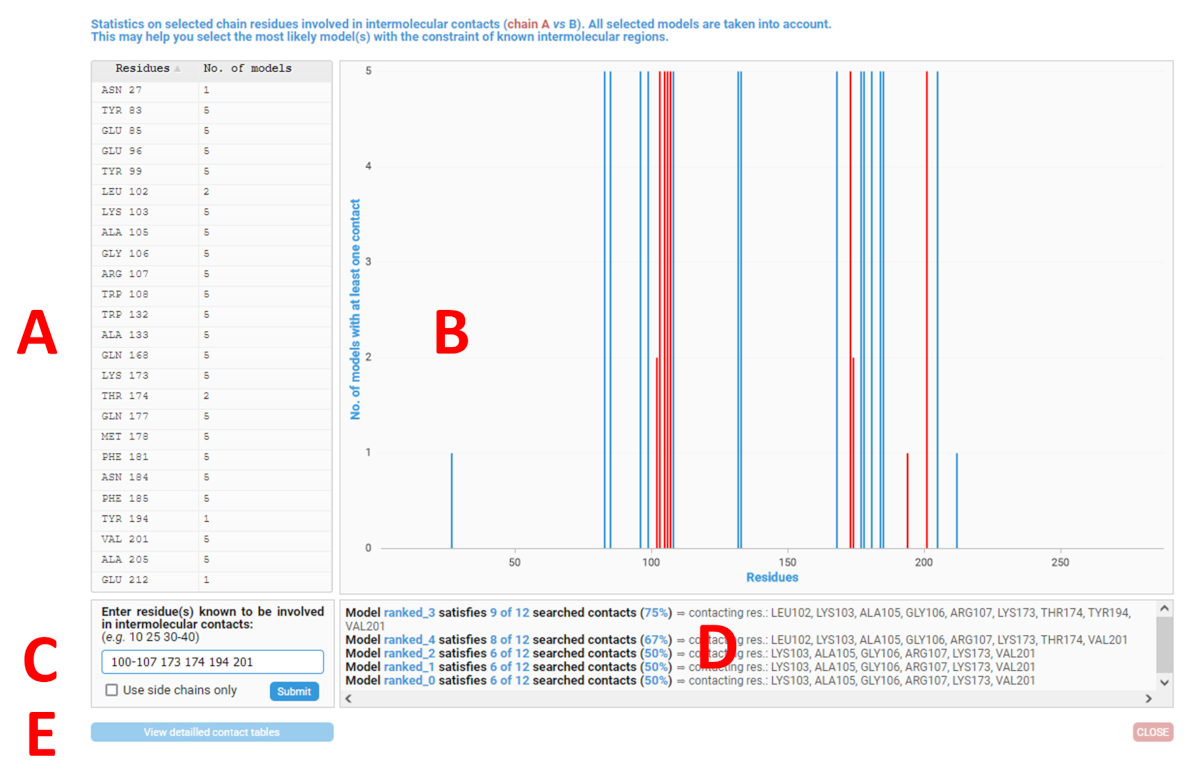
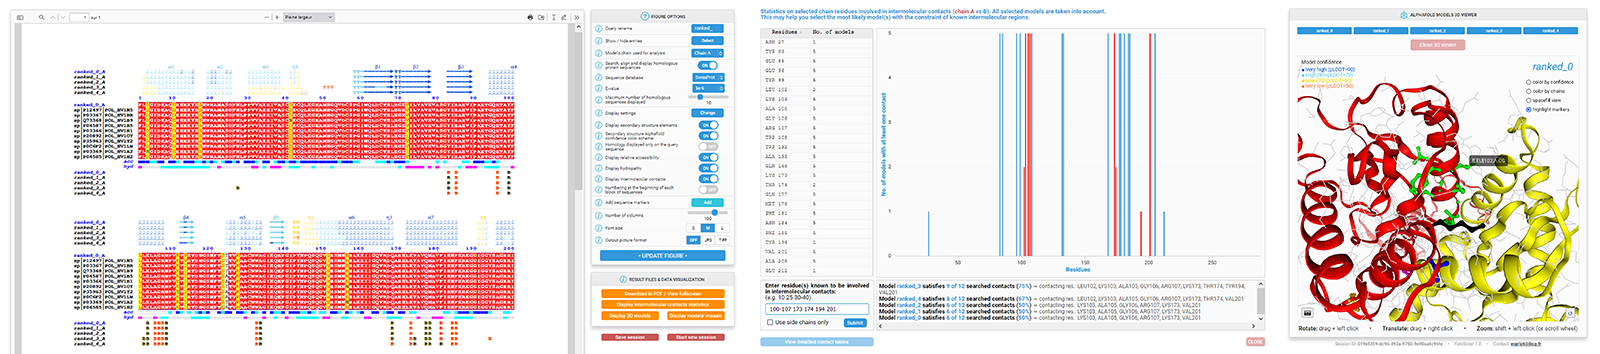
"Contacts Analysis" top button:this button is only available for multimeric models. It opens a new window (see screenshot below) which allows you to obtain statistics on residues involved in intermolecular contacts. This can help you to select the most likely model(s) with the constraint of previously known intermolecular contacting residues or regions. The reference chain ID is the one selected via the "Model's chain used for analysis" option.
A.On the left, a table shows, for each residue involved in a contact, the number of models in which this contact is present. Only selected models are considered (see "Show / hide entries" option above) while all chain IDs are taken into account.
B.On the right, a histogram presents this same information graphically. Hovering the mouse pointer over a bar in the histogram displays a list of models in which the residue in question determines a contact. Finally, you can zoom in on a part of the histogram by clicking and selecting the desired area.
C.At the bottom left of the window, the "Enter residue(s) known to be involved in intermolecular contacts" tool allows you, on the basis of residues experimentally known to be in contact, to sort the models according to the number of satisfied contacts.
Specify these residues with the following syntax: 231 242 243 247 248 250-252 258 will include residues 231, 242, 243, 247, 248, 250 to 252 and finally 258 for calculation.
If you tick the "Use side-chains only" box, only contacts involving side-chains atoms are taken into account. If not, the contacts determined by the backbone atoms are also included.
D. After clicking on the blue "Submit" button, the ranking of models satisfying contact with the given residues are presented in the bottom right results panel, from best to worst. For each model, a percentage of agreement is given as well as the list of residues involved in a contact. Finally, user-specified residues are highlighted in red both in the contact histogram (B) and the table (A).
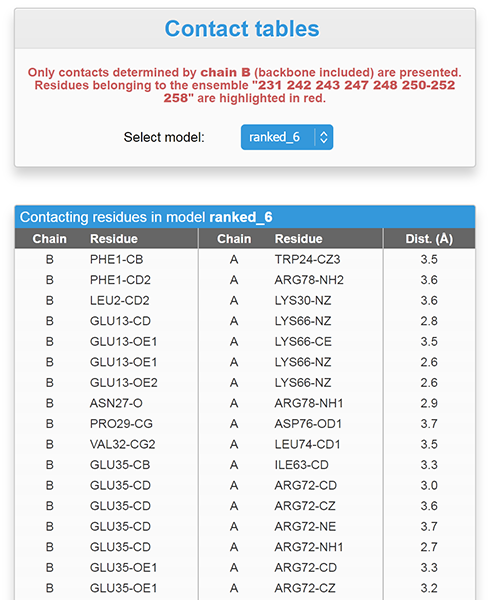
E. At the bottom of the lower left-hand frame, two buttons open a new tab in your browser with the following features:
The "View detailed contact tables" button opens a comprehensive contact table between the current chain ID and the other chains or ligands for each model uploaded (see screenshot below). Residues entered in the "Enter residue(s) known to be involved in intermolecular contacts" box are highlighted in red if present. As an example, below we are interested in the list of intermolecular contacts involving the chain B of the model ranked_6:
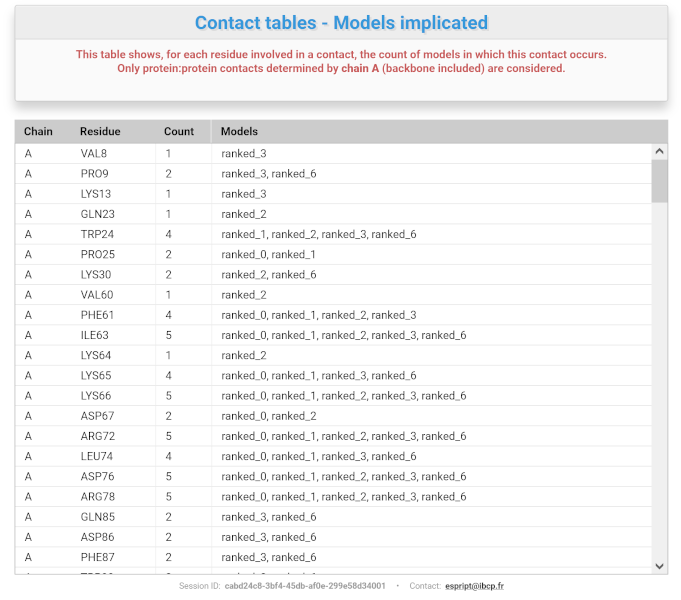
The "Contacting residues vs models" button opens a new tab with a table summarising, for each residue involved in a contact, how many - and in which model(s) - the said contact is present (see screenshot below).
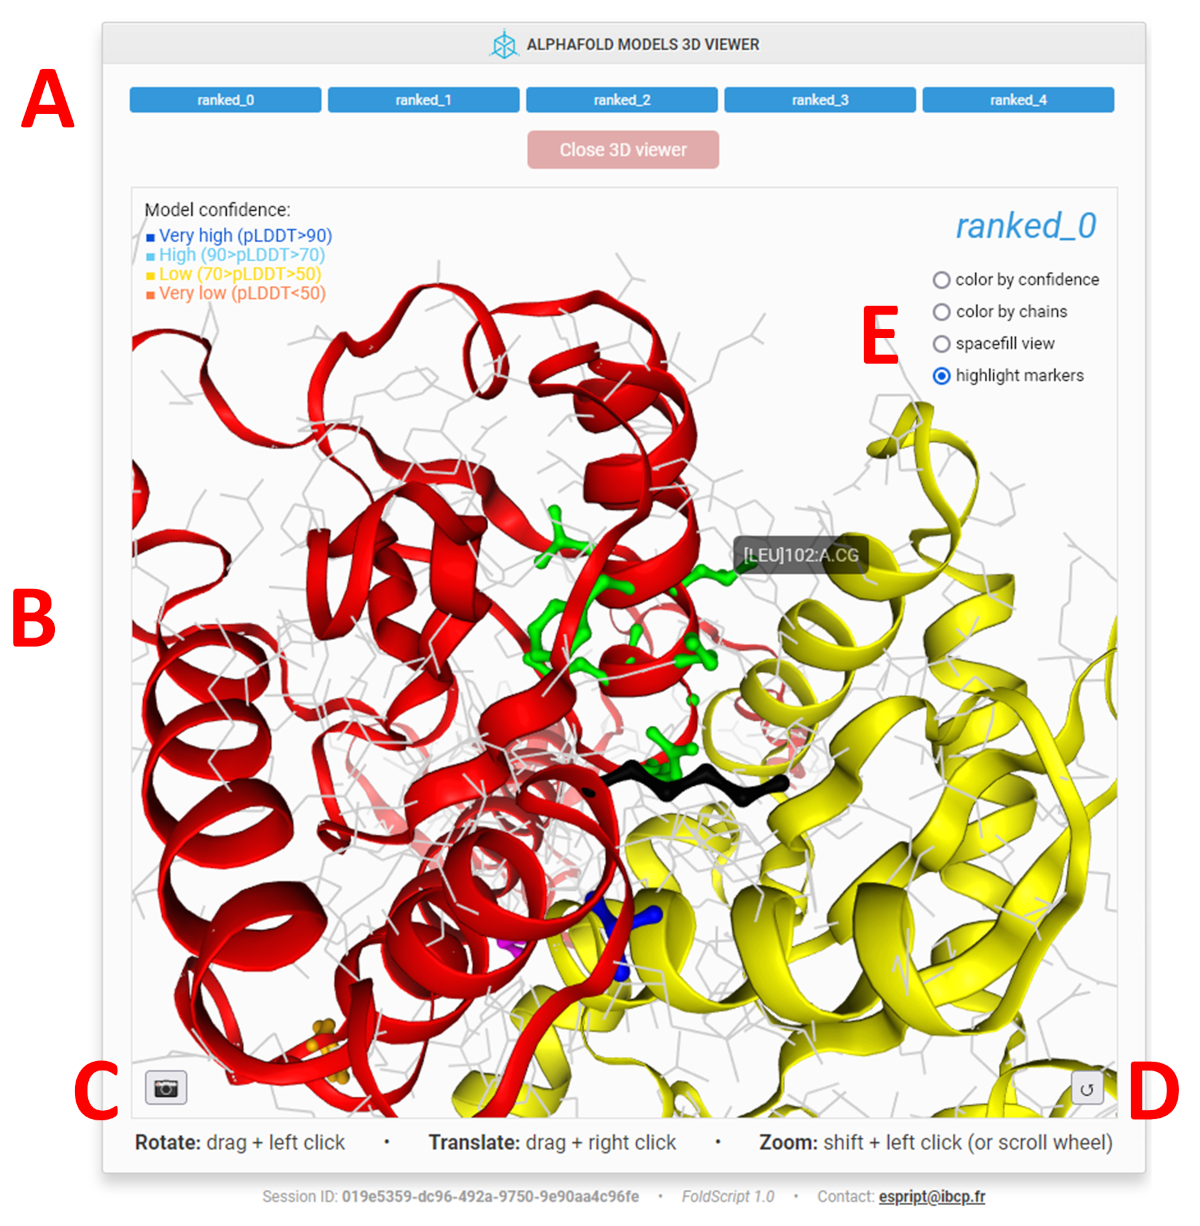
"Display 3D Models" top button: clicking this button replaces the FoldScript representation with the 3D NGL Viewer (14), which allows you to interactively examine all the models uploaded to FoldScript.
In the upper part of the window (A), you can select the model to be displayed by clicking on the appropriate button.
You can interact with the 3D view (B) using the mouse:
- Rotate: left click+drag / Translate: right click+drag / Zoom: shift+left click (or scroll wheel) / Slab: shift+scroll wheel.
- Clicking on a residue or atom will zoom in and centre the view on that location.
The bottom left button of the viewport (C) allows you to export the current view to a PNG image file.
The bottom right button (D) allows you to centre and reset the view.
The 3D viewer offers several representation schemes which can be toggled by clicking on the buttons located at the top right (E):
Color by confidence:models are represented in cartoon mode and coloured according to the AlphaFold pLDDT score (a per-residue estimate of the model confidence). Regions with pLDDT > 90 (very high model confidence) are coloured blue; regions between 70 and 90 (confident) are cyan; regions between 50 and 70 (low confidence) are yellow and regions < 50 (very low confidence) are orange. If present, nucleic acids, ligands and ions are represented in cartoon, ball & stick and sphere modes, respectively. This representation allows you to quickly distinguish areas of the model with good prediction confidence from those with low or poor confidence.
Color by chains:models are represented in cartoon mode and coloured according to their chain ID. If present, nucleic acids, ligands and ions are represented in cartoon, ball & stick and sphere modes, respectively. This representation is useful for distinguishing chains from each other in multimeric models.
Spacefill view:models are represented in sphere mode and coloured according to their chain ID. If present, nucleic acids, ligands and ions are represented in cartoon, ball & stick and sphere modes, respectively. This representation allows you to better visualise the real occupancy of the atoms and therefore the intermolecular contact zones (protein:protein and/or protein:ligand).
Surface view:models are represented in surface mode and coloured according to their chain ID. If present, nucleic acids, ligands and ions are represented in cartoon, ball & stick and sphere modes, respectively. Note that displaying the surface may take a few seconds, especially if the model is large.
This representation, similar to the 'Spacefill view', has the same purpose but with a different, more realistic rendering.
Wired side-chains: (screenshot above) this option is only available if you have defined markers using the "Add sequence markers" option of the vertical toolbar (see "FIGURE OPTIONS toolbar" section). Models are represented in cartoon mode and are coloured according to their chain ID. The side-chains of all residues are presented in atom-colored wire. Nucleic acids, ligands and ions, if present, are shown in cartoon, ball & stick and sphere modes, respectively. This representation is recommended if you want to highlight some residues and easily locate them on each of your models.
NOTE: for all these representations, residues selected in the "Add sequence markers" tab are displayed in stick and coloured as defined with the sequence markers colour option.
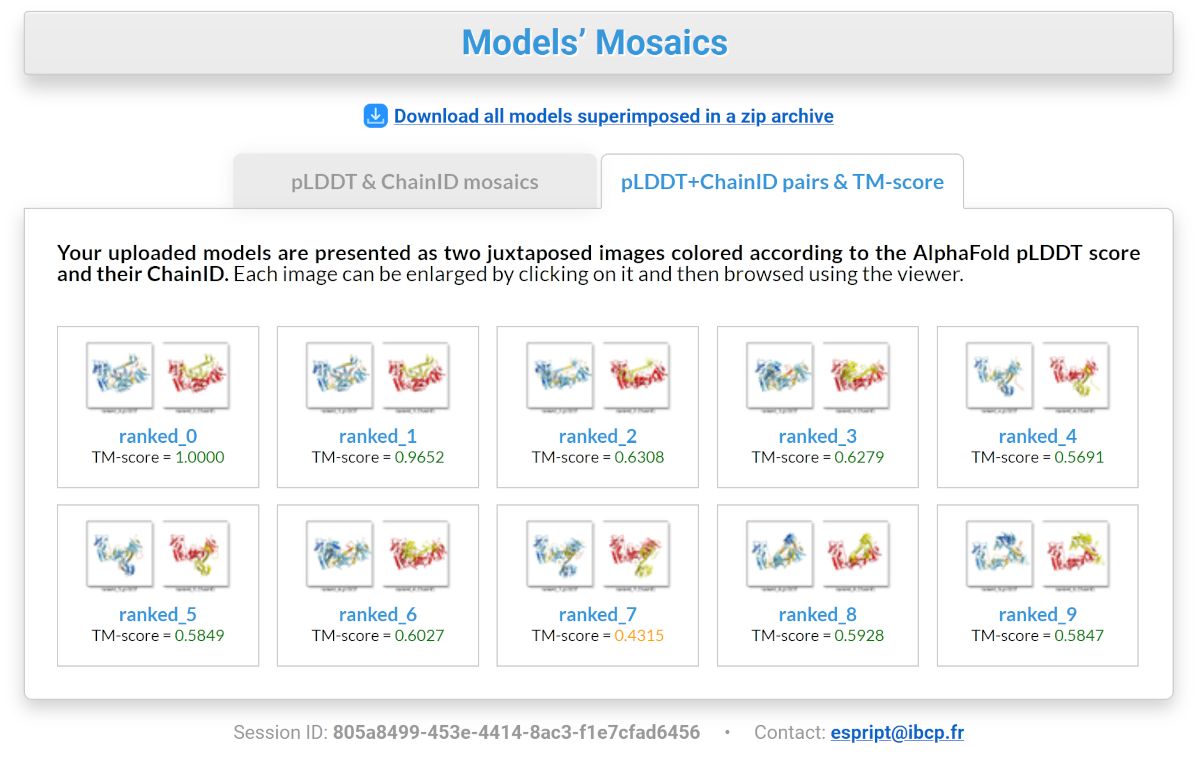
"Models’ Mosaic" top button: it allows you to display mosaics of 3D snapshots of all the models uploaded to FoldScript (see screenshot below). For this purpose, they have been superimposed on the top-ranked model, using chain A as a fixed reference. This way, all the models have the same orientation. Each image can be enlarged by clicking on it and then browsed using the viewer.
"pLDDT & ChainID mosaics" tab: all models are presented as a single mosaic image, coloured according to either the AlphaFold pLDDT score or their chain ID.
"pLDDT+ChainID pairs & TM-score" tab: each model is presented as two side-by-side images, coloured according to the AlphaFold pLDDT score and their chainID. A TM-score is shown for each model. This score (15) indicates the similarity between two structures by a number between 0 and 1, where 1 indicates a perfect match between two structures. Scores below 0.20 correspond to randomly selected unrelated proteins, whereas structures with a score above 0.5 are assumed to have approximately the same fold. TM-scores are calculated using the top-ranked model as a reference. In the case of a multimer, the whole structure is treated as a single chain.
All these views can be used to identify groups of models that share a common fold or spatial arrangement. This allows you to sort models not by their confidence score, but by their overall fold, which can be an additional decision support.
"BLAST+ Hits List" top button: it allows you to open, in a separate browser tab, a table showing all the sequence hits identified by the BLAST+ search with the selected database. For each one, the full title of the protein is given, as well as a clickable link to the corresponding database entry.
"SAVE" top button: it allows you to download a session file containing the uploaded models along with all the selected preferences of your current FoldScript session, so that you can resume your work at a later date. ⚠ Please note that any session will be permanently deleted from the server after 24 hours of inactivity and that none of your data will be retained after this time. To restore a session, simply go to the FoldScript upload page and click on the "Restore a session" tab. Click on the grey banner or drag and drop your session file. Once it has been uploaded, click on the "Submit" button and your session will be restored to the state in which you saved it.
"NEW" top button: it opens a new FoldScript session (models upload form) in another tab of your browser, allowing you to have several independent sessions in parallel.
"HELP" top button: it opens the present user guide in another tab of your browser.
Citing FoldScript
If you publish data resulting from the use of FoldScript, we would be grateful if you would include an appropriate citation:
Robert, X., Guillon, C. and Gouet, P. (2025) FoldScript: a web server for the efficient analysis of AI-generated 3D protein models. Nucleic Acids Res.53(W1), W277-W282 - doi: 10.1093/nar/gkaf326 (freely accessible online).
References
1.
Jumper J., et al. (2021) Nature, 596, 583-589
2.
Abramson J., et al. (2024) Nature, 630, 493-500
3.
Baek M., et al. (2021) Science, 373, 871-876
4.
Lin Z., et al. (2023) Science, 379, 1123-1130
5.
Guillon C., Robert X. & Gouet P. (2024) Pathogens, 13, 241
6.
Gouet P., Robert X. & Courcelle E. (2003) Nucleic Acids Res., 31, 3320-3323
7.
Robert X. & Gouet P. (2014) Nucleic Acids Res., 42, W320-W324
8.
Touw W.G., et al. (2015) Nucleic Acids Res., 43, D364-D368
9.
Kabsch W. & Sander C. (1983) Biopolymers, 22, 2577-2637
10.
Brünger A.T., et al. (1998) Acta Cryst., D54, 905-921
11.
Camacho C., et al. (2008) BMC Bioinformatics, 10, 421
12.
Sievers F. & Higgins D.G. (2018) Protein Sci., 27, 135-145
13.
The PyMOL Molecular Graphics System, Schrödinger, LLC
14.
Rose A.S., et al. (2018) Bioinformatics, 34, 3755-3758
15.
Zhang Y. & Skolnick J. (2004) Proteins, 57, 702-710
16.
Kyte J. & Doolittle R.F. (1982) J. Mol. Biol., 157, 105-132

 1.2
1.2

 On the right hand side of the Results page, a vertical toolbar allows you to customise the FoldScript representation at your convenience with several options.
 provides a help text when hovering the mouse over it.
 icon, you can see the name mapping between your uploaded model files and the names shown in the FoldScript representation.